Pace of Progress: Electrifying everything at the rate required to meet our climate goals
Download the reportThe story of new technology emerging in the marketplace, proving itself to be the better option, and becoming the standard is an inevitable one. Refrigerators. The car. Electricity itself. When a transformative new technology gains popularity over an incumbent, such as a mobile phone over a landline, adoption of that technology usually follows an S-shaped curve. Early adopters acquire the technology first, followed by a rapid uptick in adoption as the technology reaches the majority, culminating in market saturation, and the eventual replacement of the incumbent technology.
There will be an S-shaped curve for the electrification of the 1 billion fossil fuel machines across our 152 million households as well: the cars we drive, how we heat the air and water in our homes, cook our food, dry our clothes, and where the power comes for those activities. It’s the shape of this S-curve that’s important. The learning curves for clean energy are evolving at a rapid clip, with costs forever being revised down. The Inflation Reduction Act (IRA) is expected to bring climate technology costs down by 40 percent. The more costs come down, the further we will steepen the ascent of adoption.
The adoption curves of these technologies on their own, however, do not tell us the full story. Because these machines account for 42 percent of our energy-related emissions, we need to understand the adoption curve required for each of these machines to achieve our climate goals.
That is why Rewiring America has put together our first Pace of Progress report, mapping the current state of the market against what needs to be true in order to meet our emissions targets by 2050. In this report, we establish the national benchmark for the machines we need to electrify in our homes. The upshot? We have a gap of 24 million machines over the next three years above baseline market adoption projections. These first years are critically important as they will define the ramp of adoption over the next 20 years. The faster we move now, the more readily we will achieve our goals.
We are optimistic about our ability to achieve these goals because of the opportunity presented by the largest climate investment in history, the $369 billion in clean energy provisions of the IRA, which creates an electric bank account for every household in America.
Our optimism is further reinforced by the fact that all-electric technologies bring profound technological improvements with manifold co-benefits: Much like smartphones enabled billions of people around the world to have affordable access to the internet, and thus revolutionized entire segments of the world economy, there is every indication that virtuous cycles and network effects will exponentially improve the adoption of products like heat pumps and induction stoves, largely because these technologies are just so much better. And while even the highest social cost of carbon estimates do not price in these externalities, early signs tell us the market understands the broader implications of these co-benefits and is moving accordingly.
Together, these points represent key shifts in our thinking and models and illustrate why the electrification Pace of Progress is all at once extraordinarily ambitious and absolutely possible.
This report marks the beginning of Rewiring America’s efforts to count the machines and measure our progress together. We believe this is foundational because every household, community, city, state, and business has a part to play in owning their piece of this number, and working to meet the pace. In the months ahead, we will use the pace of progress to benchmark every community in the country, and to delve into Justice40 and other equity-centered considerations, to ensure that, as we work to hit our topline numbers, we do so in a way that brings everyone along.

At Rewiring America, we are working to accelerate the transition so that every household in the U.S. is using efficient electric machines powered by clean renewable energy by 2050.
The IPCC and other groups have set the target of zeroing out our national greenhouse gas emissions by 2050 to avert the worst of the climate crisis. To reach zero emissions, we know we need to stop burning fossil fuels in our homes and on our roads by electrifying everything.
To track progress toward this goal, we have calculated how many efficient electric machines (heat pumps for heating and cooling, heat pump water heaters, electric or induction stoves, electric vehicles, and rooftop solar installations) must be sold each year between now and 2050 to achieve these goals.
We know the average lifetimes of incumbent fossil-fueled machines, so we can calculate how many of each machine type must be replaced in a given year, then assume that those are replaced according to that year’s sales proportions. This is called a stock turnover model: sales proportions plus equipment lifetimes lead to equipment stock in a given year.

The S-curve adoption model starts off fairly slowly, representing modest increases in adoption in early “runway” years, then begins to accelerate quickly into widespread mass-market adoption. For products like heating systems and stoves with longer (~15-year) lifetimes, this means that we still have a three to five year runway period in which to accelerate market adoption at a manageable pace, on the order of hundreds of thousands of new sales above baseline rates. For products like water heaters, which have a shorter (~10-year) lifetime, the runway to mass-market adoption is even a bit longer. The scale of near-term runway market adoption coincides well with the rebates and tax credits in the Inflation Reduction Act. At the same time, we must act decisively and set the stage for mass-market adoption, for within a few years we will be out of runway. In time the market must move forward sustainably on its own.
Finally, we emphasize that the projections in this report are not based in any way on the current policy environment for building electrification, including the impact of the Inflation Reduction Act and the Infrastructure Investment and Jobs Act. Rather, they are meant to demonstrate a projection of the pace of progress necessary to meet the scale of the climate crisis.
Further details about our data sources and methodology can be found here.
In the following sections, for each technology — space heating, water heating, cooking, transportation, and rooftop solar — we present:
Sales curve: the sales percentage in each year of each type of machine required to reach our climate goals.
Stock curve: the number of machines of each type present in each household each year implied by the sales curve.
Target curve: how the required sales of efficient, electric machines compare to business-as-usual sales projections.
Space heating
Currently, 16 percent of homes in the U.S. use electric heat pumps for space heating. We target 100 percent of homes using heat pumps for space heating by 2050, which is about 140 million homes after accounting for growth in the building stock. To determine the market acceleration necessary to meet these goals, we compare our modeling to existing sales trends.

Most space heating machines have a lifetime around 15 years, so we set a target of electric heat pumps comprising 100 percent of sales by 2035. This yields a sales curve.

100 percent electric heat pump sales by 2035 would therefore result in 100 percent turnover of the stock of homes heating with fossil fuels by 2050. This is demonstrated in the stock curve.

We next compare the necessary sales growth rate (yellow solid line, derived from the sales proportions plot above) to existing sales growth projections (grey dashed line) to identify the sales over baseline required to put the U.S. on the desired S-curve trajectory to achieve 100 percent efficient electric heating and cooling by 2050. This is shown in the target curve above.
Now that we understand the full scope of the challenge, we can zoom in on the first few years of the target curve to identify short-term market transformation targets that, if met, will give us confidence that we are on an S-curve trajectory. For space heating we find that nationally, by 2032, electric heat pump sales need to increase three times over the business-as-usual scenario. This tells us that we need to inspire 703,000 sales of electric heat pumps over baseline in 2024, and 4.49 million sales of electric heat pumps over baseline cumulatively in the next three years.
Water heating
Currently, just one percent of homes in the U.S. use electric heat pump water heaters for water heating. We target 100 percent of homes using heat pump water heaters for water heating by 2050, which is about 140 million homes after accounting for growth in the building stock. While electric resistance water heaters are technically already electrified, heat pump water heaters are three times more energy efficient and can yield significant annual energy bill savings, so for purposes of this report we assume that the nation’s stock of electric resistance water heaters are also replaced with heat pump water heaters. To determine the market acceleration necessary to meet these goals, we compare our modeling to existing sales trends.
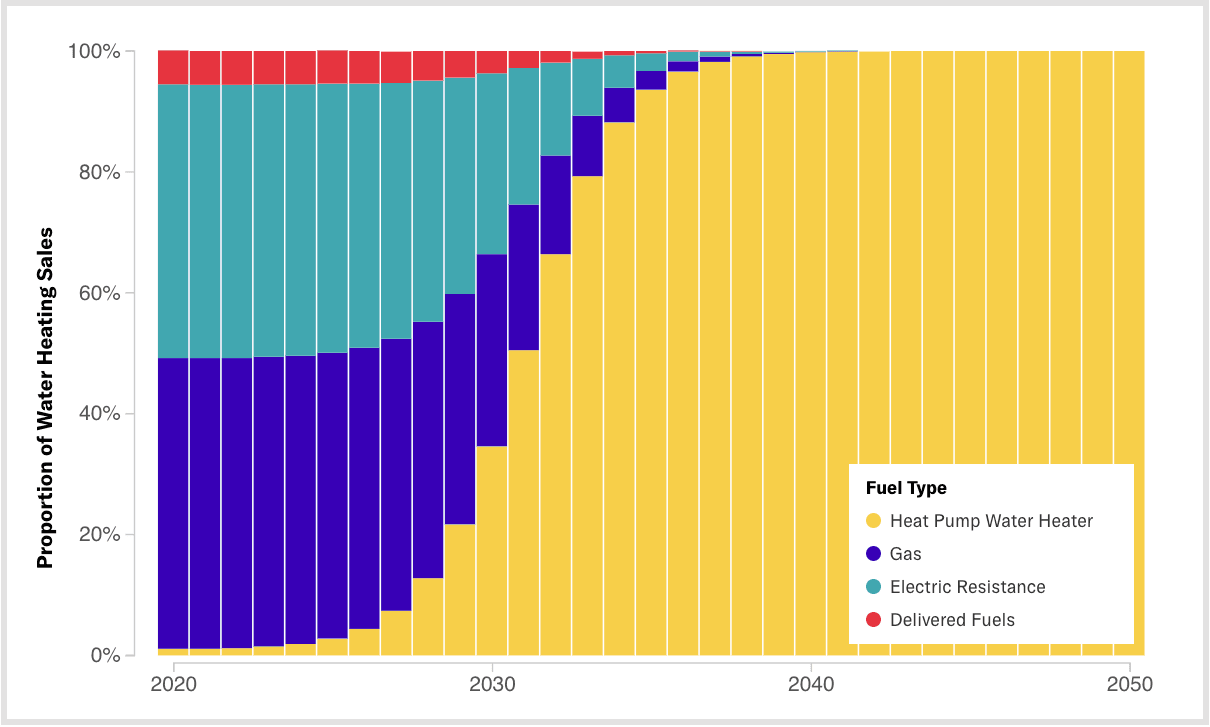
Water heaters have a lifetime around 10 years, so we set a target of electric heat pump water heaters comprising 100 percent of sales by 2040. This yields a sales curve.

100 percent heat pump water heater sales by 2040 would therefore result in 100 percent turnover of the stock of homes using fossil fuels for water heating by 2050. This is demonstrated in the stock curve.

We next compare the necessary sales growth rate (yellow solid line, derived from the sales proportions plot above) to existing sales growth projections (gray dashed line) to identify the sales over baseline required to put the U.S. on the desired S-curve trajectory to achieve 100 percent efficient electric water heating by 2050. This is shown in the target curve above.
Now that we understand the full scope of the challenge, we can zoom in on the first few years of the target curve to identify short-term market transformation targets that, if met, will give us confidence that we are on an S-curve trajectory. By 2032, heat pump water heater sales need to increase more than ten times over the business-as-usual scenario. This tells us that we need to inspire 50,000 sales of heat pump water heaters over baseline in 2024, and 542,000 sales of heat pump water heaters over baseline cumulatively in the next three years.
Cooking
Currently, four percent of homes in the U.S. use induction stoves for cooking, and 57 percent of homes in the U.S. use electric resistance stoves. Unlike the comparison between heat pumps/heat pump water heaters and electric resistance space/water heating, induction stoves do not have a significant efficiency benefit relative to electric resistance stoves. Both are about 80 percent efficient and therefore have similar energy bill impacts. For purposes of this analysis, we assume induction stoves replace only gas and propane stoves, and assume that the sales proportion of electric resistance stoves remains constant. To determine the market acceleration necessary to meet these goals, we compare our modeling to existing sales trends.

Most stoves have a lifetime around 15 years, so we set a target of electric and induction stoves combined comprising 100 percent of sales by 2035. This yields a sales curve.

100 percent electric or induction sales by 2035 would therefore result in 100 percent turnover of the stock of homes cooking with fossil fuels by 2050. This is demonstrated in the stock curve.

We next compare the necessary sales growth rate (yellow solid line, derived from the sales proportions plot above) to existing sales growth projections (grey dashed line) to identify the sales over baseline required to put the U.S. on the desired S-curve trajectory to achieve 100 percent electric cooking by 2050. This is shown in the target curve at left.
Now that we understand the full scope of the challenge, we can zoom in on the first few years of the target curve to identify short-term market transformation targets that, if met, will give us confidence that we are on an S-curve trajectory. By 2032, induction stove sales need to increase five times over the business-as-usual scenario. This tells us that we need to inspire 538,000 sales of induction stoves over baseline in 2024, and 3 million sales of induction stoves over baseline cumulatively in the next three years.
Transportation
Currently, two percent of passenger cars in the U.S. are electric vehicles. We target 100 percent of passenger vehicles being all-electric by 2050, which is about 350 million cars after accounting for growth in the vehicle stock. To determine the market acceleration necessary to meet these goals, we compare our modeling to existing sales trends.

Most vehicles have a lifetime around 20 years, so we set a target of electric vehicles comprising 100 percent of sales by 2035. This yields a sales curve.

100 percent electric vehicle sales by 2035 would therefore result in 100 percent turnover of internal combustion engines and other non-electric vehicles by 2050. This is demonstrated in the stock curve.

We next compare the necessary sales growth rate (yellow solid line, derived from the sales proportions plot above) to existing sales growth projections (grey dashed line) to identify the sales over baseline required to put the U.S. on the desired S-curve trajectory to achieve 100 percent electric vehicles by 2050. This is shown in the target curve above.
Now that we understand the full scope of the challenge, we can zoom in on the first few years of the target curve to identify short-term market transformation targets that, if met, will give us confidence that we are on an S-curve trajectory. By 2032, electric vehicle sales need to increase approximately seven times over the business-as-usual scenario. This tells us that we need to inspire 1.9 million sales of electric vehicles over baseline in 2024, and 11.3 million sales of electric vehicles over baseline cumulatively in the next three years.
Rooftop solar
Currently, five percent of homes in the U.S. have rooftop solar. We target 100 percent of single-family homes having rooftop solar by 2050, where it is technically feasible to do so according to the National Renewable Energy Laboratory’s report on Rooftop Solar Technical Potential. Since rooftop solar is not replacing existing machines, there’s no need to set a sales curve, and we can simply calculate the stock of rooftop solar over time. To determine the market acceleration necessary to meet these goals, we compare our modeling to existing sales trends.

100 percent of feasible residential buildings with rooftop solar would result in over 80 million cumulative installations by 2050. This is demonstrated in the stock curve.

We compare the necessary installation growth rate (yellow solid line, derived from the stock plot above) to existing installation growth projections (grey dashed line) to identify the installations over baseline required to put the U.S. on the desired S-curve trajectory.
Now that we understand the full scope of the challenge, we can zoom in on the first few years of the target curve to identify short-term market transformation targets that, if met, will give us confidence that we are on an S-curve trajectory. By 2032, installations need to be accelerated approximately seven times over the business-as-usual scenario. This tells us that we need to inspire 888,000 rooftop solar installations over baseline in 2024, and 4.47 million rooftop solar installations over baseline cumulatively in the next three years.
Methodology
Our methodology can be viewed here.


